Honors undergraduate thesis: computer graphics
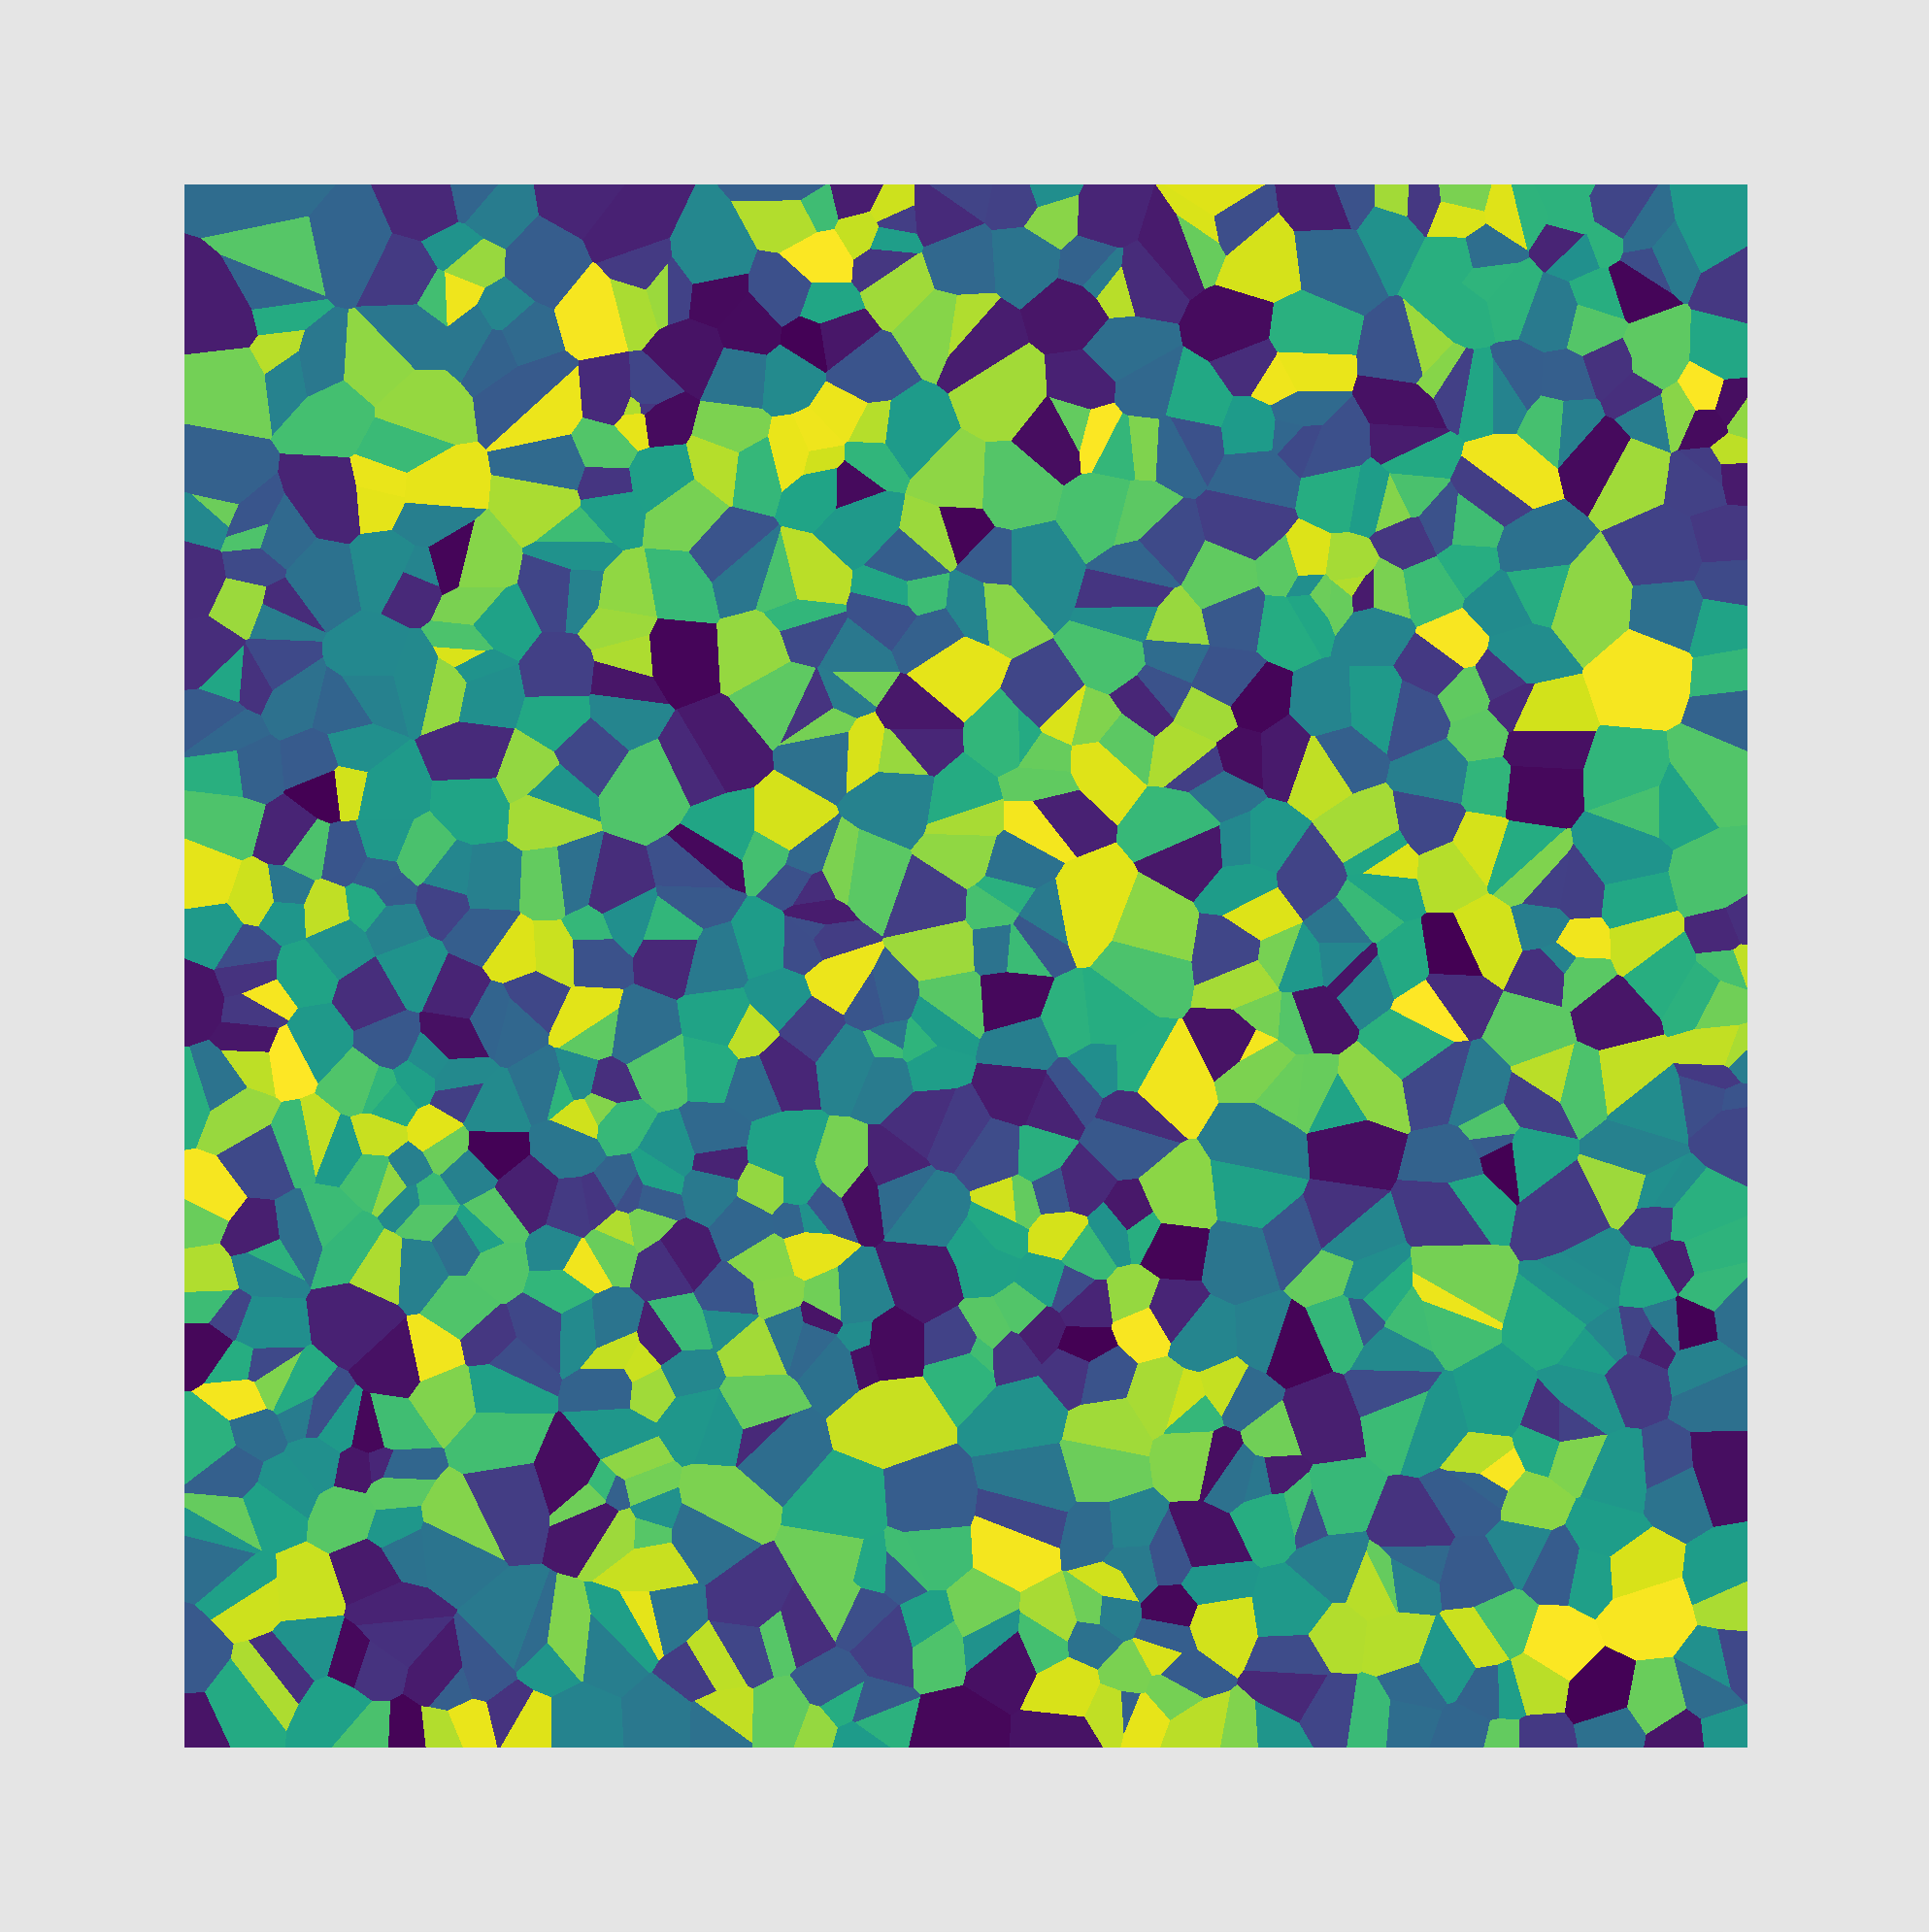
I undertook an thesis project where I used OpenGL graphics pipeline to generate Voronoi diagrams, which has potential applications to fluid simulation.
If you're interested, you can read it here.
Turtle Bird: animated film
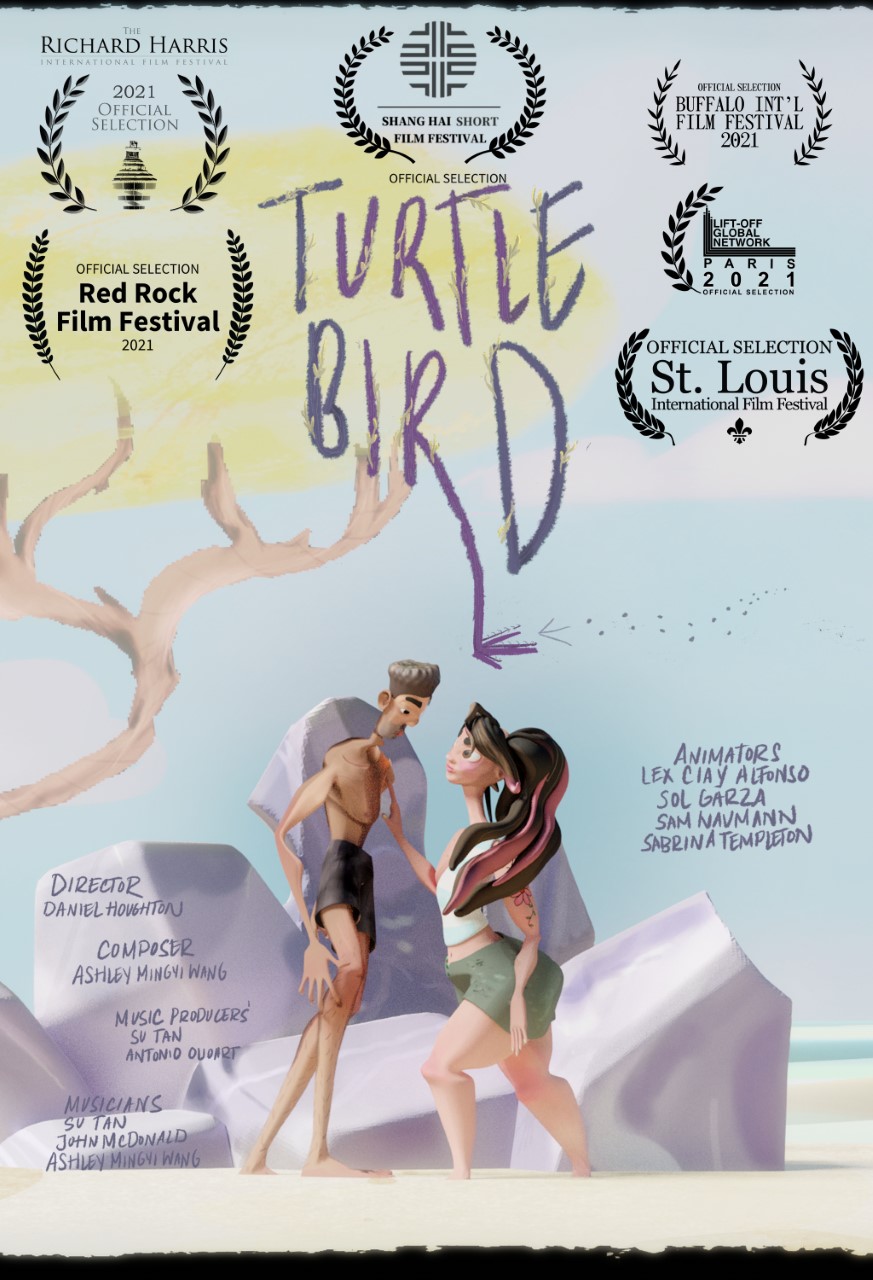
Turtle Bird is a short, animated film which has been accepted into six film festivals. As an intern, I contributed by developing 3d rigs for all of the characters. I also worked to create compositing effects when needed.
While Turtle Bird is not currently publicly available to watch, if interested in my animation work please feel free to contact me and I will send you my demo reel.
qT3: mobile app
qT3 is a prototype iOS app which algorithmically deduces information from Arabic verbs, including form, tense, root, person, gender and number. It is intended to help beginnning students of Arabic get more information about a verb than they can from any existing dictionary lookups.
For more information checkout the GitHub project, linked here.
Raytracer: computer graphics
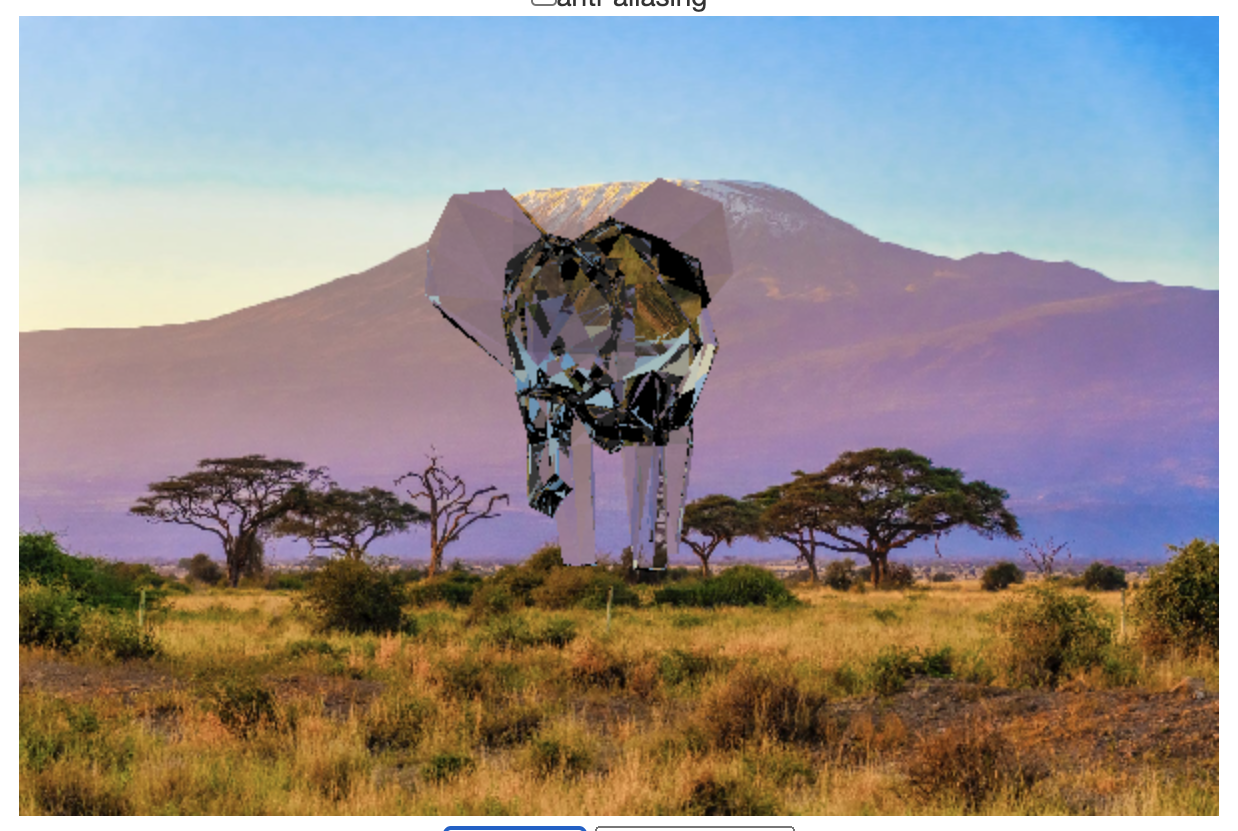
I built this raytracer using JavaScript and HTML, and then I created a custom mesh in Blender for the elephant which I imported into the scene using a python script to scrape the vertex data.
Interact with the raytracer here or view the source code on GitHub here.
Habitat for Humanity House: architectual design
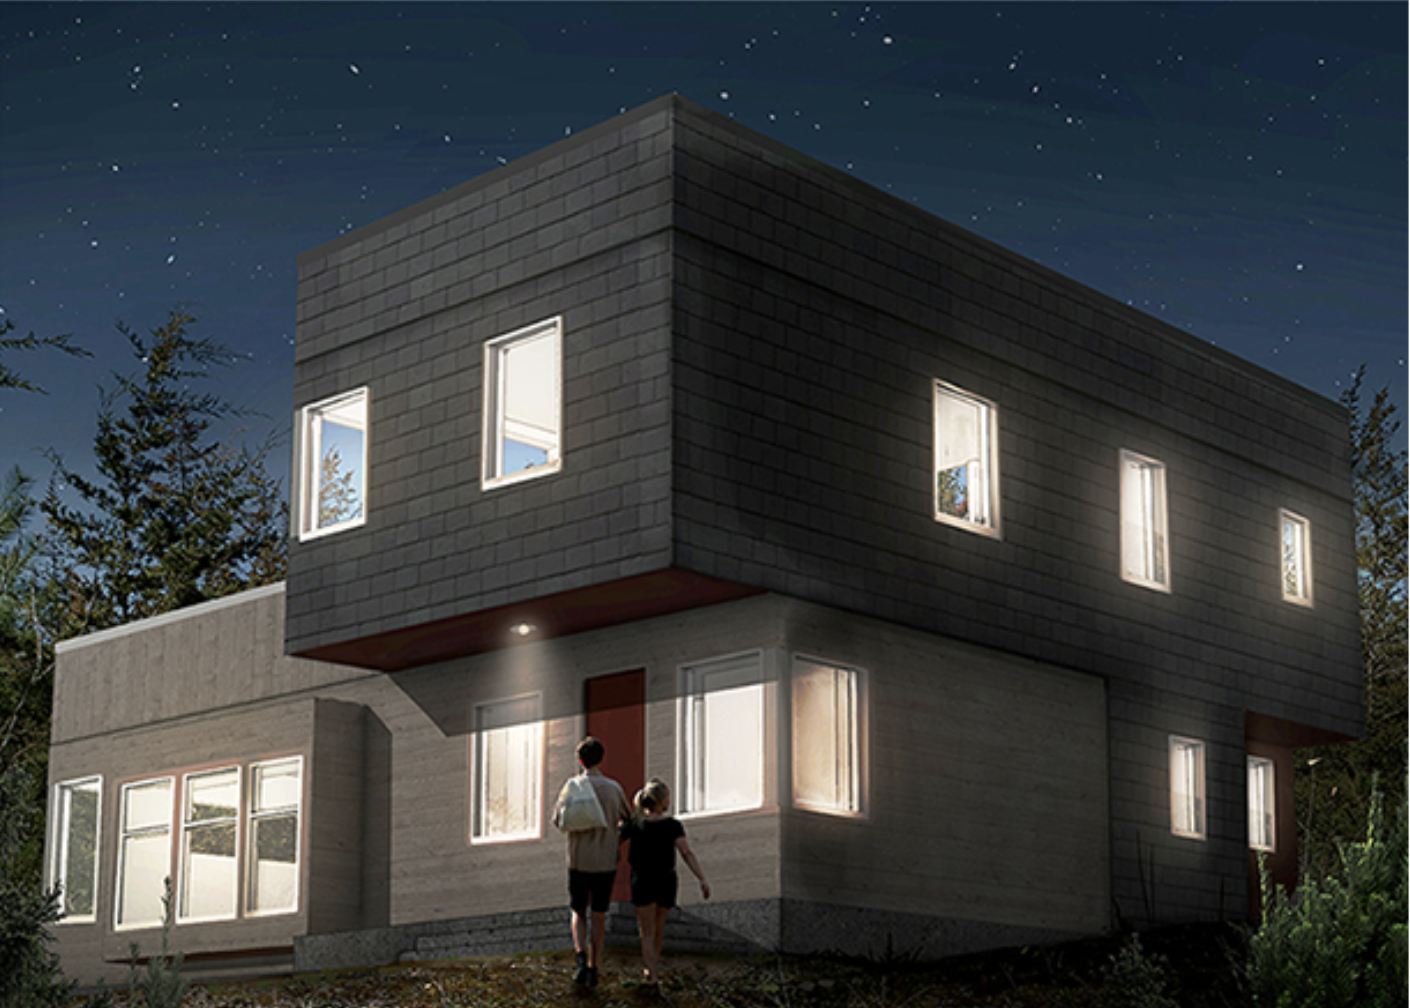
Contributed alongside a class of architecture students to the design and concept for a house which will soon be built for the Habitat for Humanity Addison County Chapter.
Roll or Die: mobile 3d game
I developed a 3d game for iOS apps using the Godot game engine and written in GDScript.
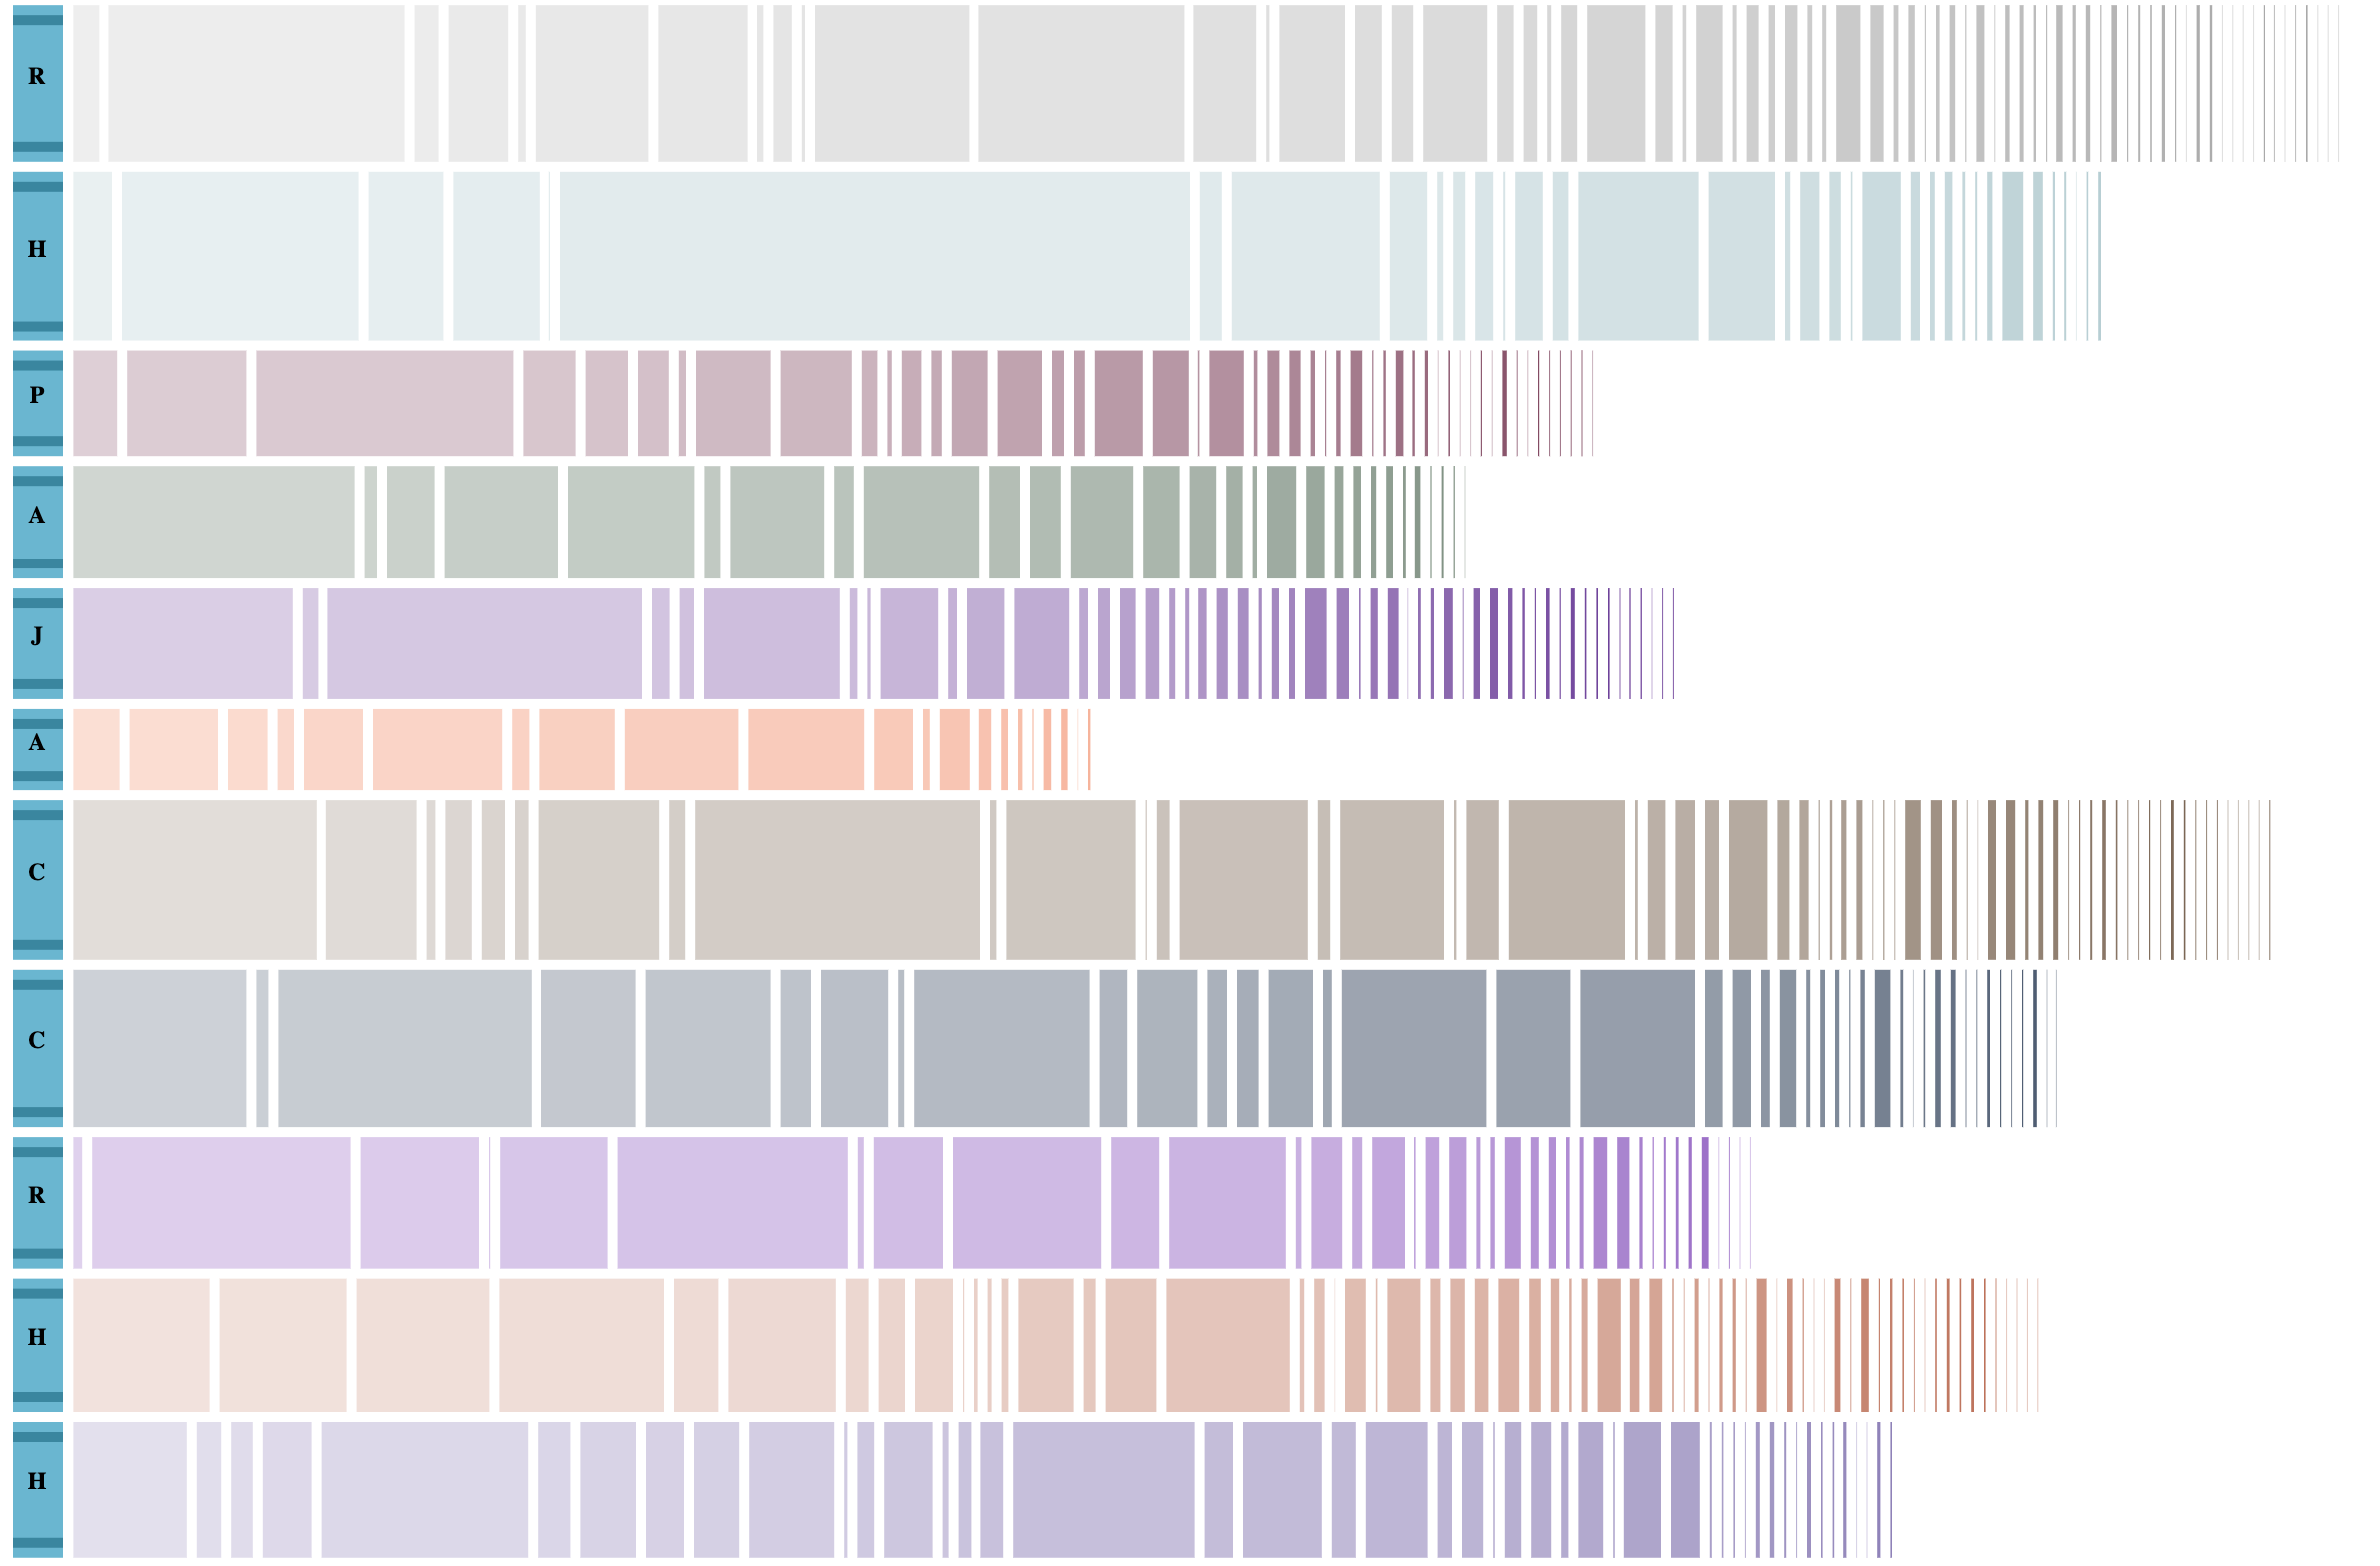
Shakespeare's Plays: information visualization